Matt Kelley, founder and CEO of PlayerProfiler, is known for coining the phrase “The Alfred Morris Corollary.” The phrase refers to the 2012 season when rookie quarterback Robert Griffin III, known for his rushing capabilities, started all but one game for the (then) Washington Redskins. That same year, teammate and fellow rookie running back Alfred Morris exploded for an RB7 finish on the season.
While there have been rushing quarterbacks before Griffin (Michael Vick comes to mind), the 2012 season with the Griffin/Morris combo sparked a more in-depth conversation about what insights this situation could provide for fantasy football. Some fantasy analysts insist that mobile or rushing quarterbacks are good for fantasy running back production. Others aren’t as confident, proclaiming such claims to be a “crutch argument” – meaning it is just as likely to be true as it is to be false (thank you, Christopher Harris).
In this article, we will take a look at the last 15 seasons, examining top-24 running back production and the corresponding quarterback rushing shares for those seasons. With this assessment, we will aim to give fantasy managers the real scoop on whether they should target running backs on teams with rushing quarterbacks.
Alfred Morris Corollary
Back to the 2012 Washington Redskins, Griffin accounted for 120 of the 519 total team rushing attempts (23.12%) which was second that year to only Cam Newton of the Carolina Panthers who accounted for 27.55% of his team’s rush attempts. Morris’s RB7 production came on 335 rush attempts for 1,613 rushing yards and 13 rushing touchdowns.
Kelley’s hypothesis, which came many years later, was that the threat of Griffin’s rushing abilities froze the second level of the defense, forcing linebackers to question their assignments and run fits. By having to account for the additional rushing threat from the quarterback, it often provides the running back the added advantage of more open gaps and space on outside runs.
This conjecture from Kelley caught on in the fantasy community, with many citing it to both explain past production and project future production. Morris’s season is among the best within the context of rushing quarterbacks with similar or higher rushing share than Griffin.
With that, let’s take a closer look at top-24 running back finishes over the past 15 seasons and the corresponding rushing share from their quarterbacks.
RB1/RB2 Finishes & Quarterback Rush Share
When looking at teams with RB1 and RB2 production, I wanted to look at what percentage of the team’s rushing share the primary quarterback on the team accounted for. This captures the number of opportunities the quarterback is “taking” away from the total potential opportunities for their running backs. I felt that this was more relevant than looking at raw rushing production (rushing yards) from the quarterback.
RB1 Finishes
Starting with RB1 finishes since 2010 (180 in total), the average quarterback rushing share for the team’s primary quarterback was 9.86%. 116 of the 180 (64.44%) total RB1 finishes came from teams with a quarterback rushing share less than the average.
If we start at 2012, the Alfred Morris season, using it as the starting point when the fantasy focus shifted to the impact of the rushing quarterback/running back relationship, the average quarterback rushing share jumps up modestly to 10.19%. 99 of the 156 (63.46%) RB1s in this reduced sample had a team with a quarterback rushing share of 10.19% or less.
Teams that produced an RB1 and a quarterback with a rushing share below the average of 9.86%, the average finish was RB6, whereas the average finish of the RB1s for teams with quarterback rushing shares above the average was RB7. Nominal difference, with the slight edge going to running backs with less mobile quarterbacks.
There were two seasons where a team produced two RB1s: the 2017 New Orleans Saints (Alvin Kamara and Mark Ingram III) and the 2020 Cleveland Browns (Kareem Hunt and Nick Chubb). Those teams had a quarterback rushing share of 7.45% and 10.93%, respectively.
RB2 Finishes
For RB2 finishes, the average quarterback rushing share was 11.07%, an increase of 1.21% versus RB1 finishes. 105 of the 180 (58.33%) total RB2 finishes came from teams with a quarterback rushing share less than or equal to the average. So while still a majority, it was a smaller percentage than the RB1 finishes.
Using the same 2012 or later cutoff as we did with RB1s, the average quarterback rush share goes up to 11.41%, with 97 of the 156 (62.18%) RB2s in this reduced sample coming from teams with quarterback rush shares below the average. Again, very similar to RB1s.
Teams where the quarterback had a rushing share below the average of 11.07%, the average RB2 finish was RB18, whereas the average finish for RB2s for teams with quarterback rushing shares above the average was RB19. So much like RB1s, the difference is nominal.
10 teams had two RB2 finishers during the season. Those teams had an average quarterback rushing share of 7.55%, though only one team had a quarterback rushing share above 8.95% (2015 Bengals at 12.21%). These RB2s had an average finish of RB19.
Lastly, 17 teams had an RB1 and an RB2 finish in the same season. The average quarterback rushing share among those teams was 7.90%. RB1s had an average finish of RB8, and the RB2 on the team had an average finish of RB19.
To summarize the overall findings of how RB1 and RB2 finishes correlate with quarterback rushing share, you are more likely to find RB1 finishes from teams whose quarterback rushes less than the league average of 10% of the team rush share.
While only 36-42% of RB1 and RB2 finishes come from teams with higher than average quarterback rush shares, there is a very minor difference in whether they finish as high-end or low-end RB1s or RB2s, regardless of the quarterback rush share.
While historical averages can provide a broad overview of the data, topics like this often benefit from a more nuanced approach. Let’s take a closer look at some of the top seasons over the years for quarterback rushing shares and how that translated into running back fantasy production.
Team/Season Grouping Methodology
To preface the framework of our analysis going forward, I will explain how I broke down the 480 team-season sample (32 teams x 15 seasons). While looking into the data, I started with an initial sample of the top-20 quarterback rushing share seasons since 2010, and it provided a very clean statistical break. As I looked at the second group of 20 teams in descending order, it once again produced a logical break in the rushing share percentages.
With the first two 20-team sample groups providing clean statistical breaks, and to maintain consistency, I decided to continue with this methodology, breaking the remaining teams into 20-team samples. Each group represents the next 20 teams in descending order based on their quarterback rushing share within their season.
Probability of RB1 Finishes
We’re going to dive a little bit into probability and statistics before we get into the actual data, so stick with me for a moment. From a pure probability standpoint, assuming all teams are equal, there are 12 possible RB1 finishes available, and 32 teams. That means each team has a 37.5% chance of producing an RB1.
Next, keeping things simple and using basic math, assuming all else is equal, you could presume that each of the 15 seasons would have an equal representation of the top 20 team seasons being evaluated. That would be 1.33 teams per season that should show up in the sample (20 teams ÷ 15 seasons).
However, we know a few things that prevent the basic math from holding up. First, we know that not all teams are equal for numerous reasons. Secondly, we already know from earlier that there are some instances where a single team produced two RB1s on the season – it’s not common, but it has happened. And third, we know we cannot have partial teams represented in a season sample, so we can assume some seasons will have one or even zero teams, and some seasons will have two or more teams.
Indeed, not every season has had a team with a top 20 quarterback rushing share over the past 15 years. Only 11 seasons are represented in this sample, and most of them are concentrated over the past five seasons.

Before we dig into the RB1 finishes that came from this 20-team sample, we need to do a little bit more math to further quantify what we should expect from these sample teams and seasons. Using a fundamental property in probability theory, we can further calculate the probability of a sampling of teams returning an RB1 finish based on the number of teams represented within a season.
To establish baseline expectations, we need to calculate how many RB1 finishes we should expect from our sample teams. We established earlier that each team has a 12/32 (37.5%) probability of producing an RB1 finish, regardless of which season they compete in. Using the principle of linearity of expectation, we can calculate the expected total RB1s by summing the individual probabilities of all teams in our sample.
For any 20-team sample, this calculation yields the same result: 20 teams × 0.375 probability = 7.5 expected RB1 finishes. This consistency occurs regardless of how those 20 teams are distributed across seasons, whether they're spread evenly or clustered in specific years.
The linearity of expectation principle ensures this approach remains valid even when teams within the same season are competing for the same pool of 12 RB1 spots. While it might seem intuitive that having multiple sample teams in one season would reduce their individual chances, each team's 37.5% probability remains constant because the constraint (exactly 12 RB1s available) applies league-wide across all 32 teams, not just our sample.
This method provides a clean, statistically sound baseline for comparing actual results against expected outcomes across all quarterback rushing share groupings. Since the result provides a constant baseline expectation across the entire sample of 7.5 RB1 finishes, it makes it extremely easy to compare against as we unpack the data.
Now that we’ve established the baseline probabilities, let’s see how reality compares.
Top-20 Quarterback Rushing Share Season Grouping & RB1 Finishes

The table above shows that there have only been three RB1 finishes from teams within the top-20 quarterback rushing share seasons in the last 15 years. Compare that to the expectation of 7.5 we arrived at previously, and the returns are less than half of what we hoped for. As Pete Campbell would say, “Not great, Bob!”
You can see that the top season was a 30.78% quarterback rushing share from the 2023 Philadelphia Eagles, and the low season was 25.09% from last year’s Baltimore Ravens. As I mentioned earlier, this provides a very clean and logical break in the rushing share percentages as we look at the next group of 20 teams.
Top 21-40 Quarterback Rushing Share Season Grouping & RB1 Finishes

As you can see above, expectations were slightly exceeded as there were eight RB1 finishes. It is .5 over expectation, and over 2.5X the results from the first sample. This is also where the famed Alfred Morris Corollary lives.
You will also notice that this sample has rushing shares that range from 20.60% to 24.82%. So, presuming a running back has what is perceived as a “workhorse” role, or dominates the remaining rushing opportunities in his backfield, a quarterback taking up to 25% of the team’s rushing share isn’t detrimental to a running back achieving a top-12 finish.
Now let’s take a look at the entire 480-team sample broken up into the 20-team groupings I discussed earlier.
Complete Quarterback Rushing Share Groupings With RB1 Finish Count & Rushing Share Min/Max

Reviewing the next two 20-team sample groups of top quarterback rushing shares (41-60 and 61-80), the 41-60 group fell short of the expectation by 2.5 with five RB1 finishes. This group had quarterback rushing shares between 17.78% and 20.47%.
The 61-80 group exceeded expectations by 2.5 with 10 RB1 finishes. This group had quarterback rushing shares between 15.52% and 17.74%.
Lastly, evaluating the remaining teams in the sample within their groupings, there is a strong hit rate of RB1 finishes across the bottom groups ranked 381-480, with three of those five groups achieving double-digit RB1 finishes. Two groups already mentioned (21-40 and 61-80) contained 18 of the 81 RB1 finishes across the top half (240) of quarterback rushing share seasons, roughly 22% of the RB1 finishes across those 12 group samples.
The top five quarterback rushing share team groups contain 30 RB1 finishes, whereas the bottom five groups contain 43 RB1 finishes. This is a 43.33% increase in total RB1 finishes from teams with the lowest quarterback rush shares compared to those with the highest.
To summarize what the data shows us, teams with very high rushing share quarterbacks (25%+) are likely to fall short of RB1 expectations. Meanwhile, teams with low quarterback rush shares produce RB1s 43.33% more often than those with high quarterback rush shares. With that, let’s look at similar data with the RB2s.
Probability of RB2 Finishes
Luckily, we are dealing with the same sample and the same number of possible RB2 finishes, so no need to go over the math again. With 32 teams and 12 possible RB2s, the expectation of 7.5 RB2 finishes remains the same.
Top-20 Quarterback Rushing Share Season Grouping & RB2 Finishes

This group returned 10 RB2 finishes. Pretty strong results at 2.5 over expectation. While these high rushing share quarterback teams did not return many top-12 results, you still received strong RB2 production. Unfortunately, even with the RB2 production in this group doing more than their share, the combined hit rate of 13 RB1 & RB2 finishes fell short of the expectation of 15.
Top 21-40 Quarterback Rushing Share Season Grouping & RB1 Finishes

Not as strong as the top-20 group, the 21-40 group only returned three RB2 finishes. Combine that with the RB1 results of eight players, and that is a combined total hit rate of 11 players returning top-24 production, falling short of expectations by four players. The combined shortfall notwithstanding, the strong RB1 hit rate should not dissuade you from drafting players in offenses with moderately high quarterback rush share projections.
Complete Quarterback Rushing Share Groupings With RB2 Finish Count & Rushing Share Min/Max

Looking at the total RB2 output by the quarterback rushing share groups, it is fairly well distributed throughout. There are some very strong hit rates amongst the top half, with four double-digit results, whereas in the bottom half, there is only one double-digit result, with the remaining results spread out more evenly with fewer valleys. So with all of this information, what is it telling us?
Assessing The Data
The data discussed above is helpful to an extent. When you look at the extreme outliers (very high quarterback rush shares and very low quarterback rush shares), you see different results. Quarterback rush shares above 25% resulted in less than half of the expected RB1 finishes, but 33% more than the expected number of RB2 finishes.
Conversely, you see results that are 33-47% above expectation for RB1 finishes coming from several of the lower quarterback rush share groups. Additionally, we see much lower than expected RB2 results coming from the top-20 group.
What this suggests is that while quarterback rushing share may matter on the extremes, in most cases, the factors that matter most are likely going to be team environment, backfield competition, quality of the offensive line, and overall team quality. Team environment includes things like offensive coordinator tendencies, pace of play, and quarterback experience.
A final note on the historical context of this conversation, it’s worth pointing out how actual NFL teams have evolved with the emergence of the rushing quarterback. Of the top 40 quarterback rushing share seasons, 21 of them have come in the past five years. While teams likely factor in how this added dimension may impact their overall rushing attack, it is clear that more teams see value in this quarterback archetype than they did 15 years ago.
With all of these factors to consider, let’s take a look at the list of 2025 quarterbacks and their projected rush share (based on Mike Clay’s projections) to see if we can project what we might see from those backfields.
Projected 2025 Quarterback Rush Shares

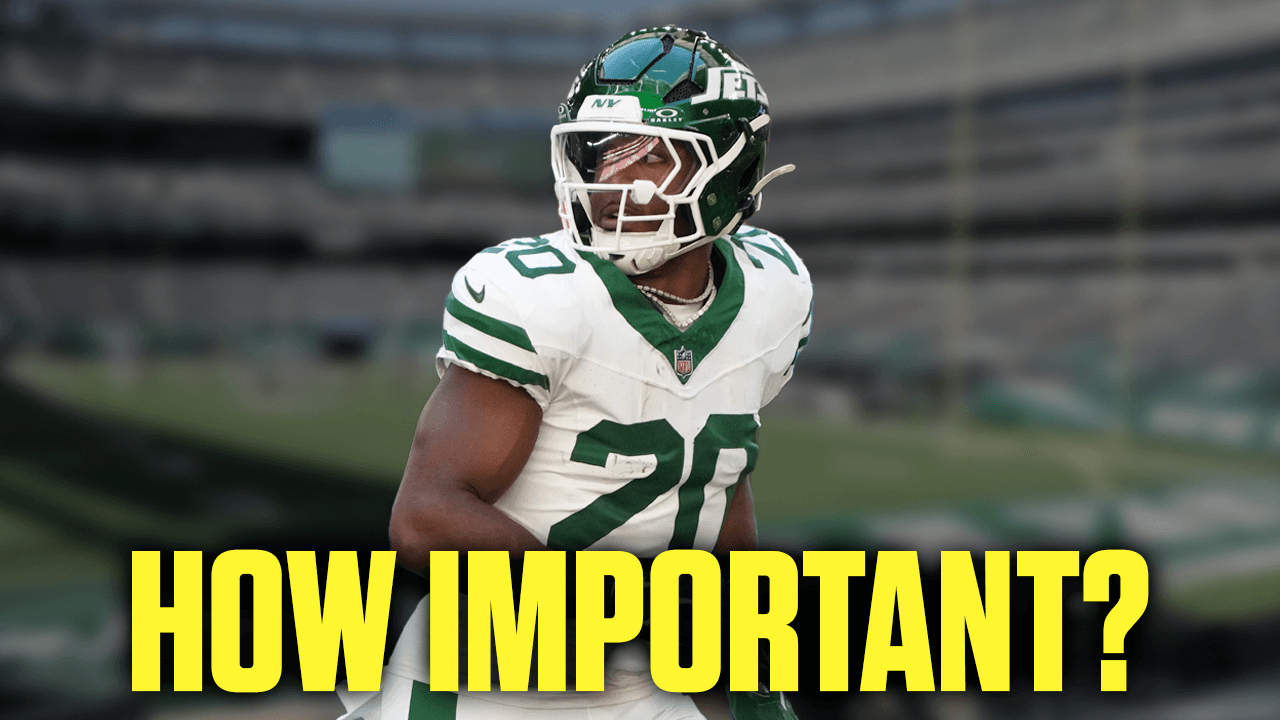
This year’s projections find Justin Fields at the top of this list, with an extremely high projected rush share of 30.48%. This is a resurrection opportunity for Fields, and the Jets are likely banking on him to be their starter all year. There is no denying his rushing prowess, but it’s everything else about his game that should concern us when projecting the success of his backfield.
Tyrod Taylor is the backup, and given his experience, I would not be shocked if the Jets turned to him if Fields isn’t proving to get the job done. Regardless, if Fields does run the show all year and rushes as much as projected, this does not bode well for Breece Hall, even as the projected RB1 on the team.
There were already rumblings from new head coach Aaron Glenn about how they intend to allocate backfield opportunities. While talent should win out, Hall may have to rely on passing volume and efficiency if he wishes to claim a top-12 running back finish this year.
Next on the list is Jayden Daniels, projected for a rush share of 29.26%. This projection is slightly higher than he had last year (28.14%). The running back room hasn’t changed much except for the addition of rookie Jacory Croskey-Merritt.
Brian Robinson Jr. failed to achieve even an RB2 finish last year playing only 14 games, and Austin Ekeler is on the downslope of his career and only played 12 games himself. If anything, the addition of Croskey-Merritt would limit the upside that either of the veteran backs has. This is a situation I am avoiding, given the backfield split and projected quarterback rushing share.
The next one on the list is Jalen Hurts, coming in with a projection of 27.26%, which exceeds last year’s share of 24.15%. His projected rushing attempts are the same number as he had last year, though the projected team rush attempts are down to 554 compared to the 621 in 2024.
Barring injury, regardless of the 3%+ increase in projected rush share, I expect similar results to last year with Saquon Barkley returning an RB1 season. I referenced in a previous article Barkley’s bad luck of being tackled 11 times inside the 1-yard line last year. Convert a couple more of those into touchdowns, and baby, you’ve got a stew going!
Rounding out the over 25% group is Lamar Jackson, coming in at 25.48% which is only slightly higher than his 25.09% last year. He is projected with a few more carries than last year, on a team rush attempt total of 569 compared to the 554 attempts last year.
With the nominal difference in projected rush share, and the ageless Derrick Henry back for year two with the Ravens, it’s all systems go for Henry again this season. The identity of the Ravens is to run the ball, and they are projected to lead the league in rush attempts. As long as Henry doesn’t fall off the age cliff, I would lock in another RB1 season.
The only other quarterback projected for over 20% rush share is Josh Allen with 21.80%. This situation is a bit more complicated, as James Cook’s role on the team is undecided as of now. He may hold out for a larger contract, and if that happens, I would expect the Bills to split work between second-year running back Ray Davis and eighth-year veteran Ty Johnson, limiting either’s chance at a high-end finish.
Focusing our attention on the lower group, the Cleveland quarterback grab bag combined projection is just over 15% of the team rush share. For Quinshon Judkins, who projects to be the team’s RB1, this situation is more about team uncertainty than quarterback rushing share. As I discussed in my rookie running back article, I project a slow launch for the Browns this year.
Even if the rookie finishes strong, fantasy football is a full-season game, and top-end finishes are decided across entire seasons, not just the second half. He may reach RB2-level production simply on volume, as long as the Browns don’t find themselves in too many negative game scripts.
Of the remaining projected RB1s yet to be mentioned and their respective teams, the Falcons, Lions, Dolphins, Packers, and Rams all project to have quarterback rushing shares under 10%. The 49ers, Raiders, Colts, and Buccaneers all project to have quarterback rushing shares under 16.39%.
The Colts’ situation is one to monitor, with Anthony Richardson projected with a 16.39% rushing share and Daniel Jones with an 11.23% rushing share. If Jones starts the entire season, I would expect his projection to approach Richardson’s.
If all this holds, nine out of the 12 projected RB1s would come from teams with quarterback rushing shares well under 20%.
Several projected RB2s (Kenneth Walker III, James Conner, RJ Harvey, Omarion Hampton, D’Andre Swift) all have quarterbacks with projected rushing shares in the mid to upper teens. Several others have projections in the upper single-digits to low teens.
Given the quarterbacks at the top of the rushing share list and what the data suggest, we could expect the aforementioned Hall and Robinson Jr. to return RB2 seasons if things break right for them. Also, if Aaron Rodgers can get the Steelers on track early, Kaleb Johnson could emerge as an RB2 candidate – this may end up having more to do with the pace of play and rushing volume, though the Steelers are projected in the upper half of the league in team attempts.
Before we conclude this article, let’s further break down how you could implement this information into your draft strategy.
Fantasy Draft Strategy Framework
Based on this analysis, here's how to approach running backs by quarterback rushing share tiers:
**High Alert Zone (25%+ QB Rush Share):**
- Avoid as RB1 targets unless they're elite talents with proven workhorse usage
- 2025 examples: Saquon Barkley, Derrick Henry
- Consider as RB2 options - they often exceed expectations at this tier
- 2025 examples: Breece Hall, Brian Robinson Jr (outside shot)
**Sweet Spot Zone (15-25% QB Rush Share):**
- Target these RBs - historically outperform expectations for RB1 production
- The Alfred Morris Corollary lives here
- 2025 examples: James Cook (holdout dependent), Jonathan Taylor (starting quarterback dependent), and darkhorse R.J. Harvey
**Low Rush Share Zone (<15% QB Rush Share):**
- Generally safe RB1 targets, extremely low-share teams produce 43% more RB1 seasons than high-share teams
- Less upside from defensive scheme advantages, but more opportunity volume
- 2025 examples: Most projected RB1s fall into this category
What Matters Most?
Given the data above, what does matter most? Is the Alfred Morris Corollary real?
Based on what I have seen, I am certainly not going to ignore when a team has a quarterback with a projected rushing share of 25% or more. If the RB1 on that team doesn’t have a projected workhorse role or three-down skill set, I likely won’t bank on him returning a top-12 finish. The data suggest they fail to do so more than half the time, versus expectation.
However, I am aware that rushing quarterbacks present a challenge to defenses, requiring them to devote an additional defender to the threat of a quarterback run, providing the running back opportunities not present with less mobile quarterbacks. This cannot be overlooked, though there seems to be a threshold where the quarterback is taking away too many opportunities in the backfield rather than opening up more efficient ones for his running backs.
NFL teams see value in rushing quarterbacks as well, evidenced by over half of the top 40 quarterback rushing share seasons over the past 15 seasons occurring in just the last five. As more teams continue to value the use of rushing quarterbacks as a weapon, we may start to see new trends emerge as it relates to running back production.
When evaluating running backs this season, use quarterback rushing share as a tiebreaker between similarly projected players. If choosing between two mid-round RBs, favor the one whose quarterback rushes less. If targeting a back behind a high-rushing quarterback, ensure they have the talent and role security to overcome the statistical headwinds.
The Alfred Morris Corollary is real - it just has more specific parameters than we originally thought.